I was a joint PhD student between the University of Cape Town and CAASTRO at University of Western Australia. I worked mainly with Prof. Renee C. Kraan-Korteweg and Prof. Tom Jarrett, I also spent some time working with Prof. Lister Staveley-Smith at UWA
My PhD main goal is to provide a map of the large- scale structure of galaxies hidden in the Zone of Avoidance and predict the flow fields using the Tully-Fisher relation. Two surveys have been launched that combine the HI 21-cm data, which is not affected by dust extinction, and NIR data, which suffers less from dust than optical to arrive at two distinct survey samples for ZOA galaxies. A merging of this survey with the 2MTF survey should give the first real whole-sky sample.
NIR Tully–Fisher in the Zone of Avoidance – I. On how to extend the NIR Tully–Fisher relation to be truly all-sky
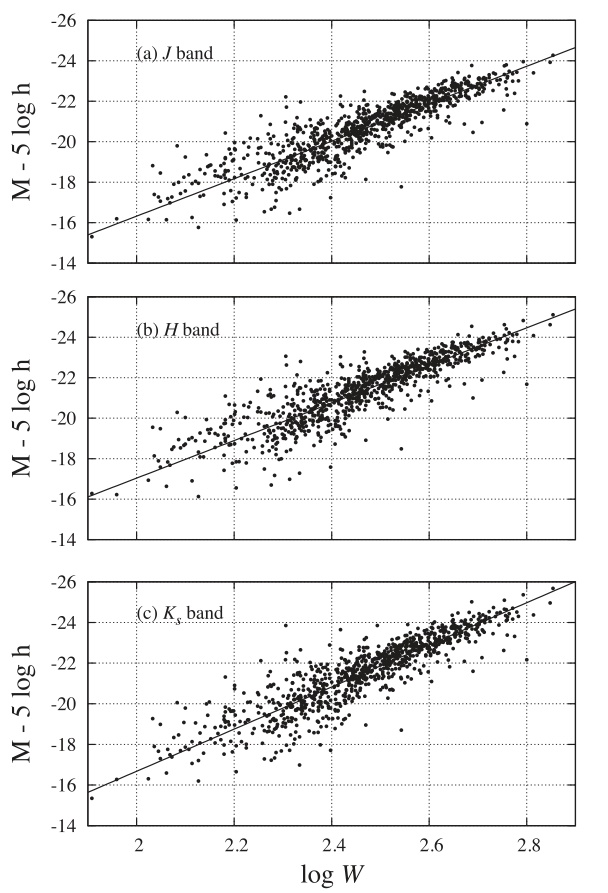
Figure 1: Isophotal TF relation for the (a) J band, (b) H band, and (c) Ks band. The solid line shows the respective bivariate fit to the data.
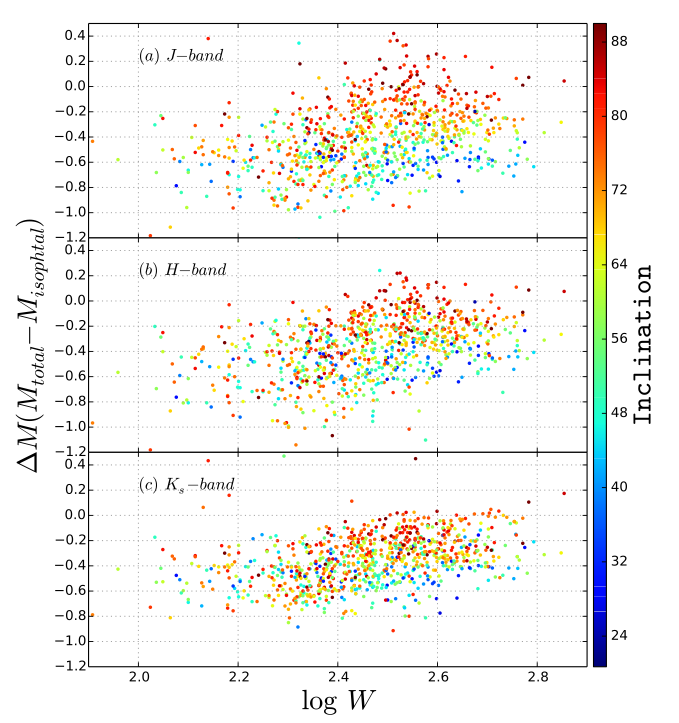
Figure 2: Total versus isophotal magnitude for the template galaxies as a function of line-width. Galaxies are colour-coded by its inclination.
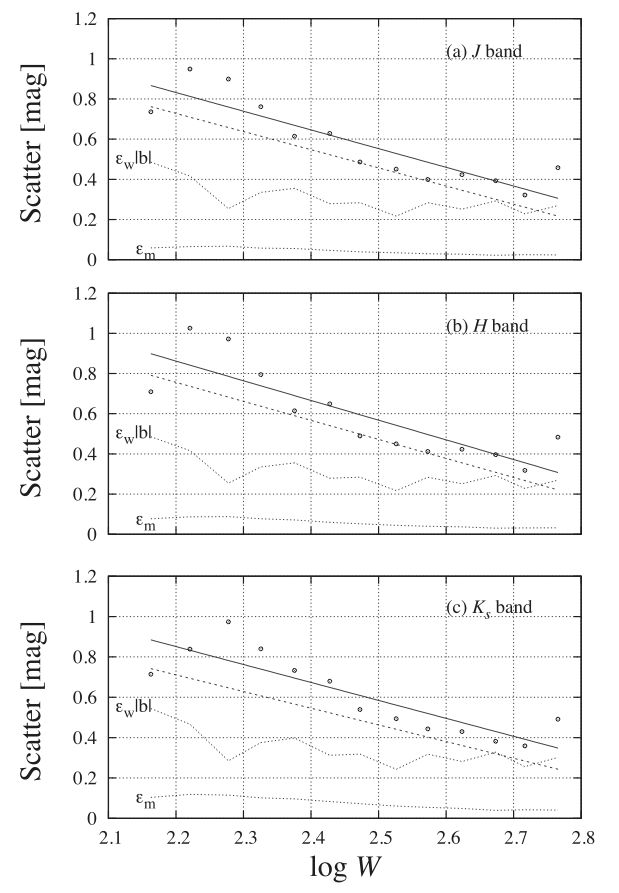
Figure 3: Scatter in the (a) J band,(b) H band, and (c) Ks band. The circles present the total scatter averaged within bins in velocity width. The linear fit to the total scatter is shown as a solid line and the dashed line shows the linear fit to the intrinsic scatter. The dotted lines present the error on the isophotal magnitude and the error on the rotation width multiplied by the slope.
NIR Tully–Fisher in the Zone of Avoidance – II. 21 cm H I-line spectra of southern ZOA galaxies
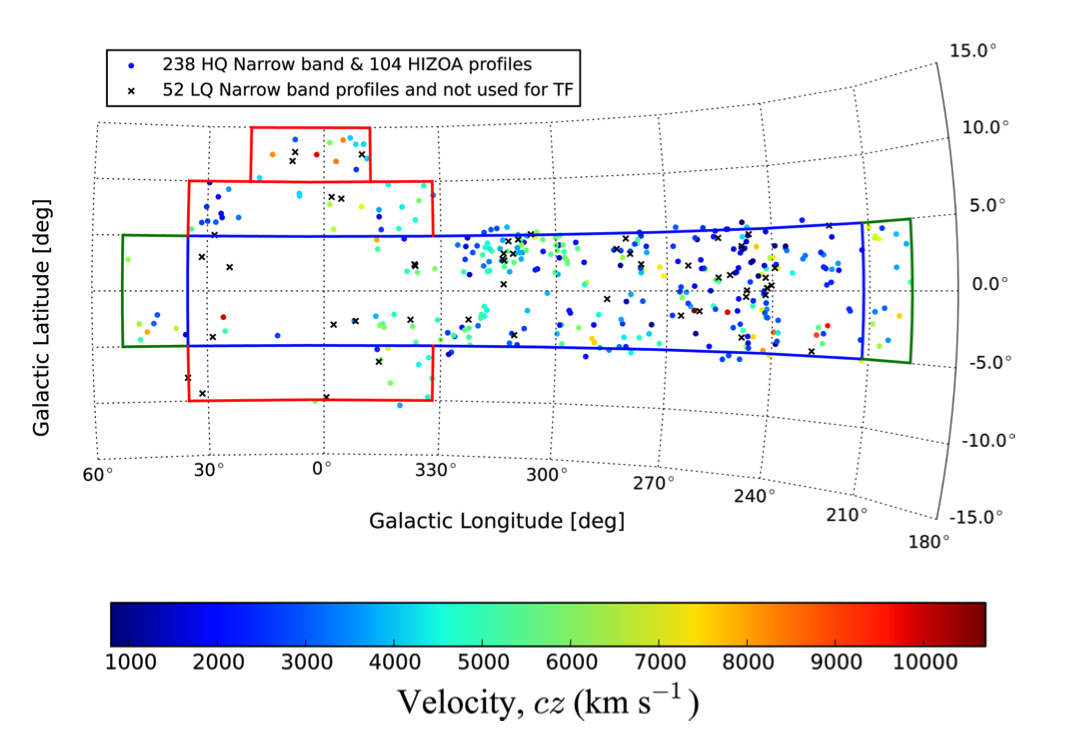
Figure 1: The distribution of the 394 inclined spiral galaxies in the TF sample with accurate NIR photometry shown in a zoomed-in Aitoff projection: High Quality (HQ) narrow-band observations of 238 galaxies and 104 additional HIZOA galaxies with HQ H I profiles are shown as circles colour coded by their velocity cz; Low Quality (LQ) narrow-band observations of the 52 galaxies discarded from the TF are shown as black crosses. The boundaries of the three HIZOA survey areas are plotted in blue (HIZOA-S), green (HIZOA-N), and red (GB). Note the wall-like structure of the Norma supercluster at 290◦ < l < 340◦ and cz ∼ 4800 km/s.
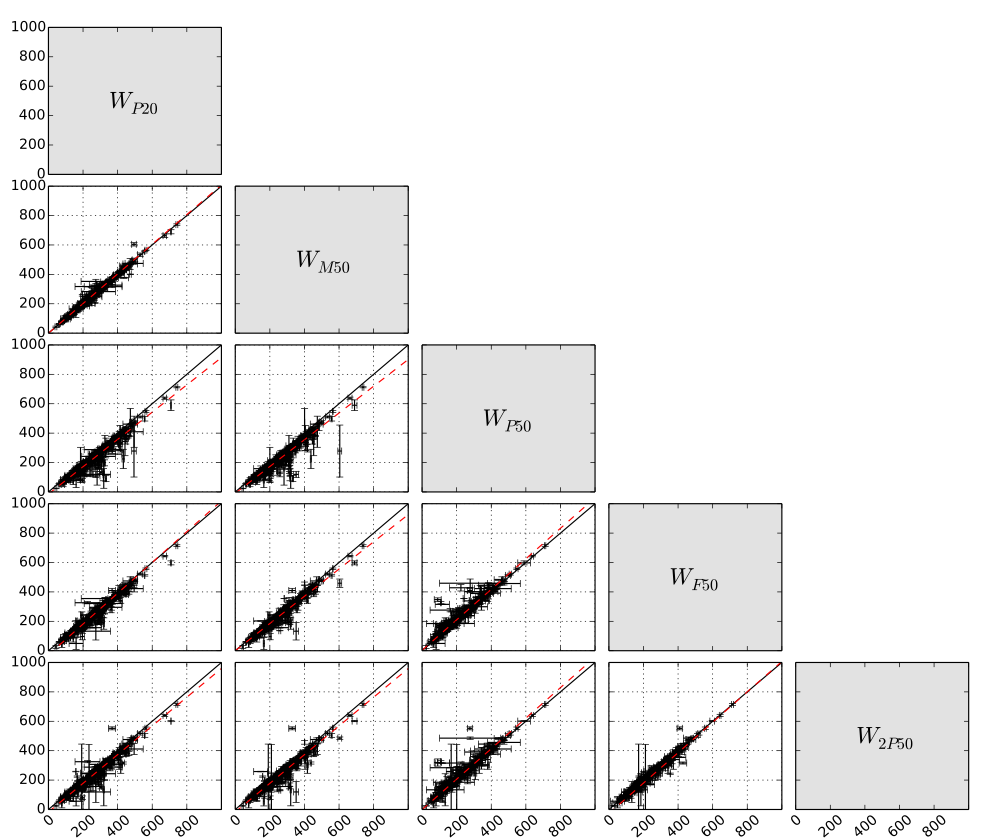
Figure 2: A matrix of pairwise plots of the five linewidth measurements. The solid line shows the one-to-one relation, while the dashed red line is the best-fitting model to the data. Almost perfect correlation was found between WP20 and WM50 also between WF50 and W2P50 (within the uncertainty). A large offset was found between the two most used linewidths in the TF analysis WM50 and WF50.
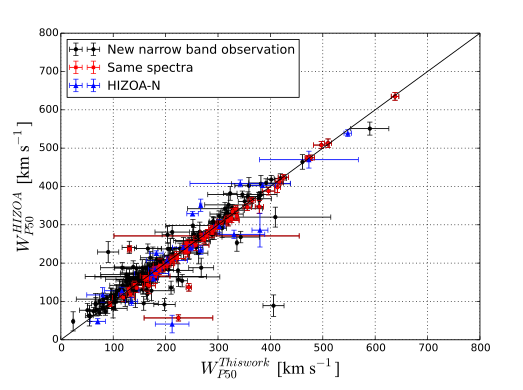
Figure 3: A comparison between WP50 measured in this work using a modified version of the GBTIDL function AWV and WP50 measured in HIZOA surveys using MIRIAD task MBSPECT. The solid line shows the one-to-one
relation.
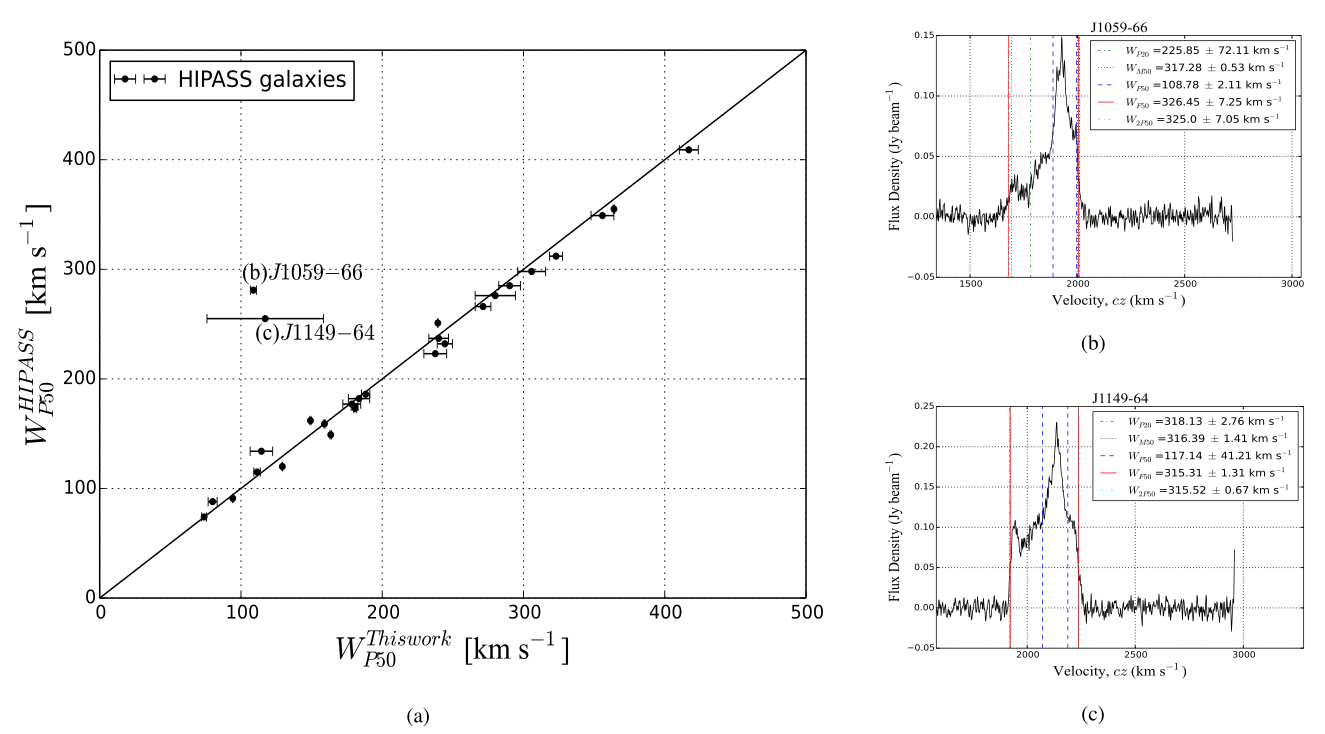
Figure 4: A comparison between WP50 measured in this work using a modified version of the GBTIDL function AWV and WP50 measured in HIPASS survey using MIRIAD task MBSPECT. The solid line shows the one-to-one relation.
NIR Tully–Fisher in the Zone of Avoidance – III. Deep NIR catalog of the HIZoA galaxies
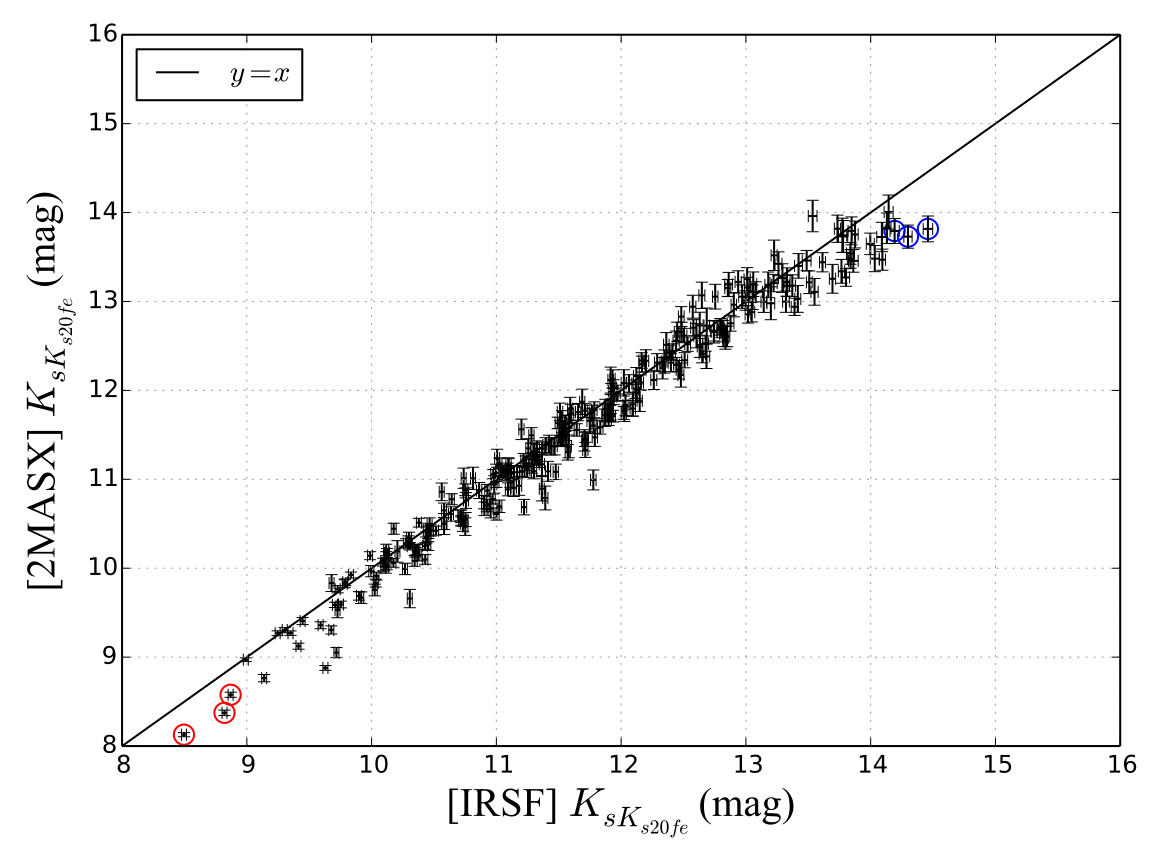
Figure 1: Comparison between Ks bands Ks20 fiducial elliptical aperture magnitudes derived for this catalog and the same parameter reported in the 2MASX catalog.
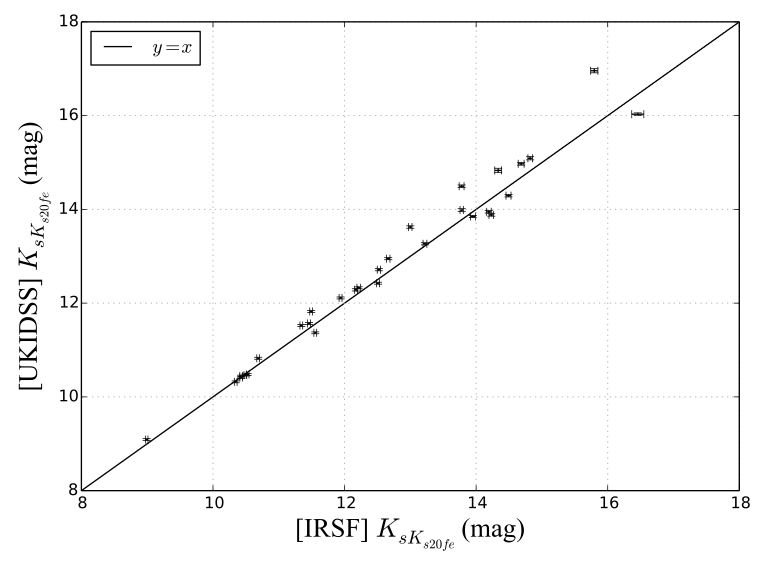
Figure 2: Comparison between Ks bands Ks20 fiducial elliptical aperture magnitudes derived from the IRSF images and the same parameter derived from the UKIDSS GPS images using a modified version of the IRSF photometry-pipeline to fit the UKIDSS images.
NIR Tully–Fisher in the Zone of Avoidance – IV. Peculiar velocity of galaxies in the southern ZOA
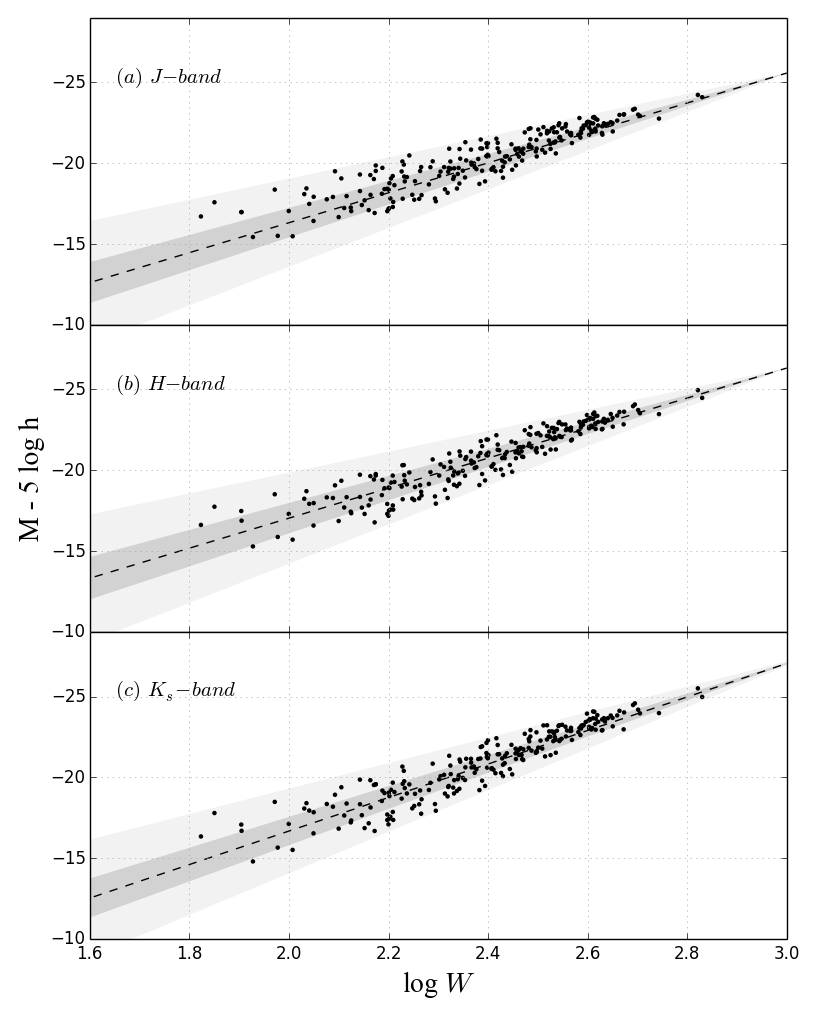
Figure 1: Tully-Fisher relation for galaxies in the ZoA. Absolute magnitude of our sample derived from IRSF isophotal magnitude in the J-band as a function of rotation width. The dashed line denotes the TF relations in J-band and the shaded area shows three times the TF intrinsic scatter.
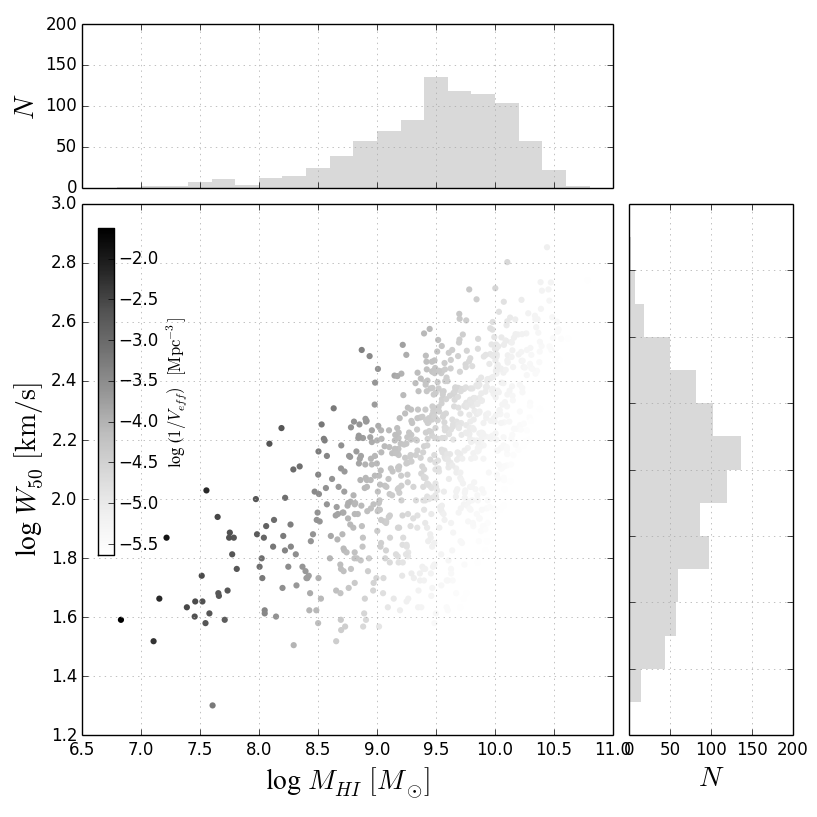
Figure 2: HIZOA galaxy density distribution in the MHI, W50-plane. Each dot present a galaxy colour coded by the reciprocal of the effective volume available to it in logarithmic scale. This effective volume is calculated via the two-dimensional stepwise maximum likelihood method.
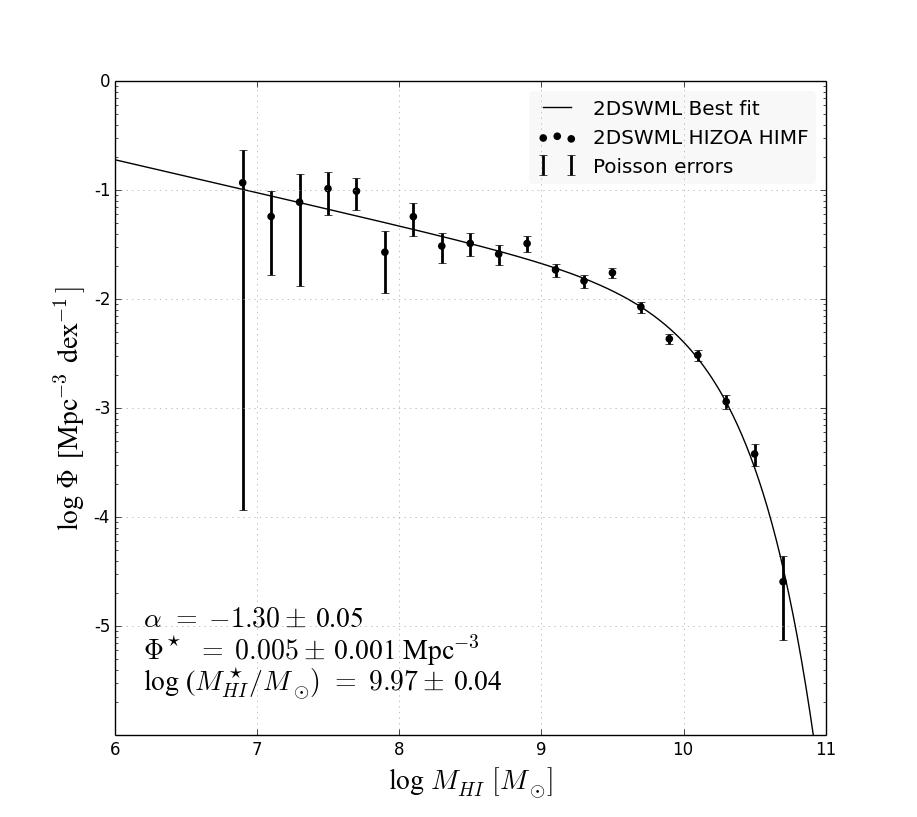
Figure 3: HIZOA HI mass function derived via the two-dimensional stepwise maximum likelihood method.
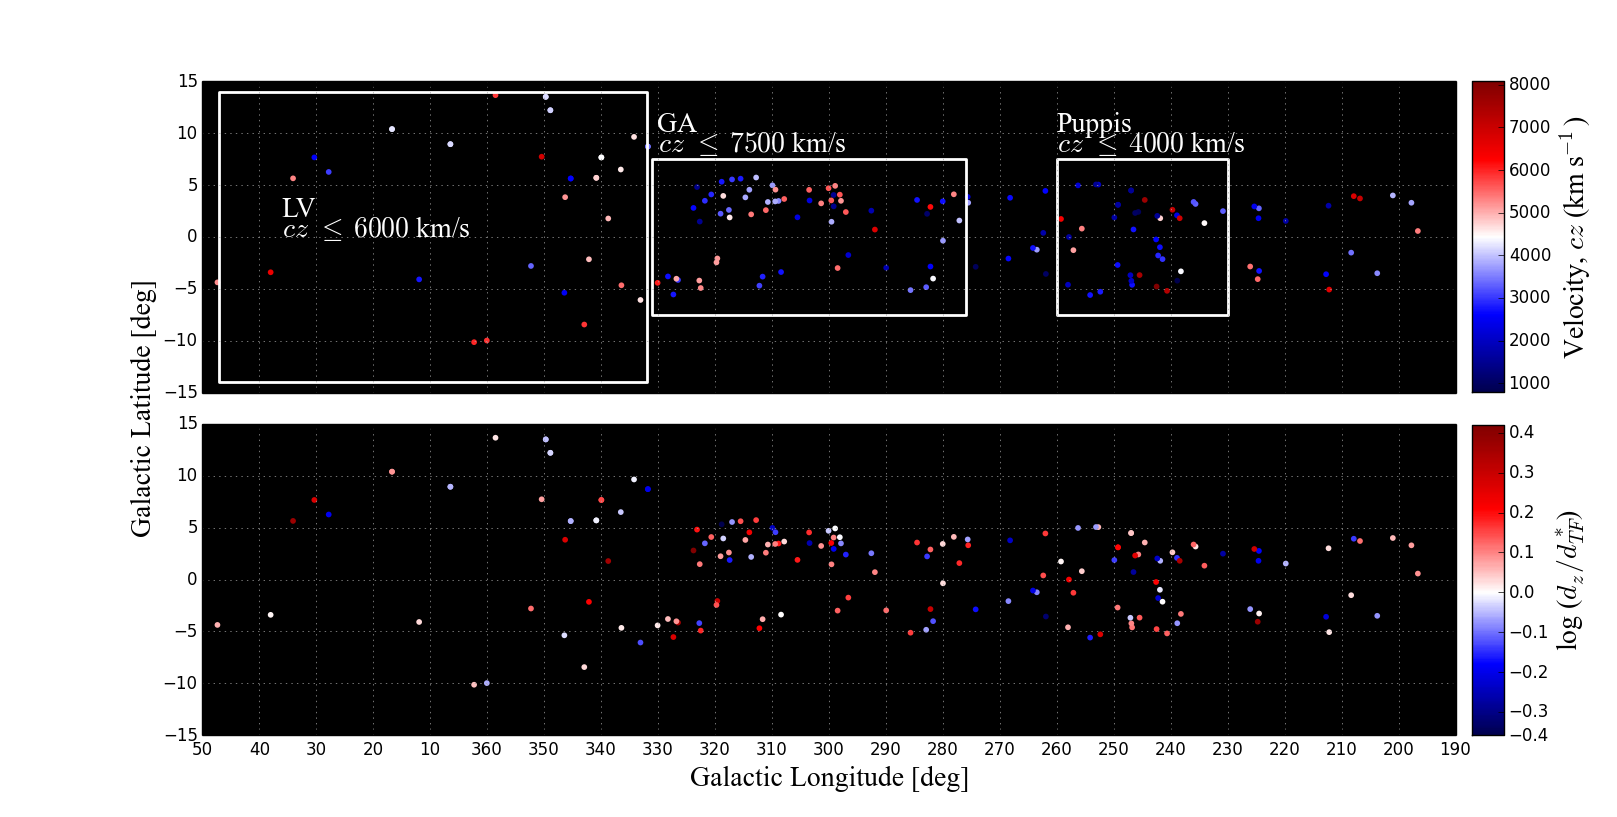
Figure 4: Distribution of our ZOA TF galaxies in Galactic latitude (l) and longitude (b). Galaxies are colour-coded by redshiftz in the top panel and by the logarithmic distance ratio in the bottom panel. The approximate positions of Puppis, GA, and LV are marked with white rectangles.